What is under Mayon, and how anyone knows.
This page is the whole of the app's interior journey in words. Nothing here needs 3D graphics: every station, every depth estimate, and every piece of evidence is written out, in the same order the journey visits them.
How to read this
Depths follow published estimates. Shapes, widths and routes are drawn to explain, not scanned.
Findings from lavas erupted 1928–2009. Not a description of Mayon today — for current activity, follow PHIVOLCS.
Every depth on this page is measured below the summit (2463 m above sea level), because the published estimates use different reference points and would otherwise appear to disagree by kilometres for no reason. Where the underlying sources do disagree, the disagreement is stated rather than averaged away.
Every depth estimate on one page
| Estimate | How it was obtained | Reference point | Uncertainty |
|---|---|---|---|
| near the surface to about 4–8 km below the summit | Pressures recorded by minerals and dissolved gas in erupted lavas | below-summit. Depth measured from the summit, as in the paper’s plumbing diagram. | Mineral pressure estimates carry wide uncertainties, and they do not line up with the geophysical estimate. |
| about 6–8 km below the summit (4–5 km below sea level) | Gravity and ground-tilt measurements, as summarised by Ruth & Costa | below-summit. Published as 4–5 km below sea level; converted by the authors to about 6–8 km below the summit. | Does not match the mineral estimate; the authors suggest either method’s uncertainties may explain the gap. |
| about 18–20 km below the summit | Pressures recorded by pyroxene and amphibole crystals in erupted lavas | below-summit. Pyroxene barometry gives 18–20 km; a single amphibole estimate gives about 19 km below the crater. | Barometers have wide uncertainties; a preliminary seismic study pointing to a magma body near 20 km is unpublished. |
| about 30 km below the summit | Conceptual model combining the estimates above | below-summit. The depth to which the authors’ conceptual model extends. | Significant melt is not necessarily present at every depth in this range. |
An open vent
Mayon is an open-vent volcano: gas escapes from its summit persistently. Researchers infer that gas from deeper magma rises through shallower melt and out through an open conduit.
In the app you can follow the gas. Gas is shown rising from storage, through the conduit, to the summit.
For more than a hundred years, Mayon has had mid-size, mildly explosive eruptions roughly every ten years, each smaller than 0.1 km³, with occasional steam-driven eruptions.
How do we know? An open vent
What was observed. Gas escapes from Mayon’s summit persistently. Over more than a century, mid-size, mildly explosive eruptions — each under 0.1 km³ — have come roughly every ten years.
What researchers infer. Crystal textures suggest gas moves up from deeper magma through shallower melt and reaches the air through an open conduit.
What the scene illustrates. The rising bubbles show that idea. Their size, number and path are drawn for clarity.
What remains uncertain. This describes the period studied. Volcanoes can change their behaviour over longer spans of time.
Sources.
Routes through the mush
Below the summit, the model is not a single lake of molten rock. It is a crystal-rich mush threaded by narrow pathways — and each eruption may take a different route.
In the app you can trace one eruption’s route. One possible route is highlighted. Tap again to compare another.
Crystals record when new magma arrived and mixed: from a few days to about 65 years before eruption, mostly less than the ten-year gap between eruptions. Fresh magma kept arriving nearly continuously over the years studied.
How do we know? A different route each time
What was observed. In more than 200 crystals, most record a mixing event within the roughly ten years before the eruption that carried them out.
What researchers infer. New magma arrived nearly continuously between 1928 and 2009, with little recycling of crystals from one eruption to the next. Each eruption probably drew on a small part of the system, through pathways that may or may not be reused.
What the scene illustrates. The glowing routes are possible pathways, sketched to show that idea. No individual pathway has been mapped.
What remains uncertain. Where, how wide and how many pathways there are is not known.
Sources.
- Ruth & Costa (2021), A petrological and conceptual model of Mayon volcano (Philippines) as an example of an open-vent volcano. Bulletin of Volcanology 83:62 · CC BY 4.0 — Abstract; Fig. 15 caption
Crystal-rich storage
Minerals in erupted lava record the pressure where they grew. Read together, they point to magma stored from near the surface to several kilometres down, crowded with crystals.
In the app you can compare depth estimates. Two estimates, drawn side by side. They do not line up neatly.
Depths mentioned here. near the surface to about 4–8 km below the summit; about 6–8 km below the summit (4–5 km below sea level).
Lavas erupted between 1928 and 2009 are about half crystals by volume, and their overall chemistry stayed remarkably steady.
How do we know? Two ways to estimate depth
What was observed. Minerals record the pressures at which they grew. Separately, gravity and ground-tilt measurements respond to material beneath the volcano.
What researchers infer. Minerals point to storage from near the surface to about 4–8 km below the summit. Gravity and tilt point to about 6–8 km below the summit (4–5 km below sea level).
What the scene illustrates. The two bands show where each estimate falls. Both are drawn at depth below the summit so they can be compared.
What remains uncertain. The estimates do not match. The authors suggest the uncertainties in either method could explain it.
Sources.
- Ruth & Costa (2021), A petrological and conceptual model of Mayon volcano (Philippines) as an example of an open-vent volcano. Bulletin of Volcanology 83:62 · CC BY 4.0 — Geologic background; Discussion
How do we know? Magma crowded with crystals
What was observed. Lavas erupted from 1928 to 2009 are about half crystals by volume, and their overall chemistry stayed remarkably steady.
What researchers infer. Magma is stored as a crystal-rich mush, and much of its crystal cargo may grow in the years between eruptions.
What the scene illustrates. The clustered shapes stand for crystals in a mush. Real crystals are far too small to see at this scale.
What remains uncertain. How much of each storage region is liquid, and how that has changed since 2009, is not known.
Sources.
Where magma may begin
Deeper still, mineral pressures point to a second crystal-rich region about 18–20 km below the summit — possibly where hotter, wetter magma first enters the system.
In the app you can what constrains this?. Solid: supported by mineral pressures. Dashed: preliminary. Fading: where the model simply continues.
Depths mentioned here. about 18–20 km below the summit; about 30 km below the summit.
The conceptual model extends to about 30 km below the summit, although significant melt need not be present at every depth.
How do we know? The deeper system
What was observed. Pyroxene and amphibole crystals in the lavas record high pressures.
What researchers infer. Those pressures point to a deep crystal-rich region about 18–20 km below the summit — possibly where hotter, wetter magma first enters the system. The model reaches about 30 km.
What the scene illustrates. Solid forms show what mineral pressures support. Dashed and fading forms show weaker or preliminary evidence, and where the model simply continues.
What remains uncertain. A seismic study suggesting a magma body near 20 km is preliminary and unpublished. Significant melt need not exist at every depth down to 30 km.
Sources.
Follow a Crystal
Crystals that grew beneath Mayon were carried up in erupting lava. Their layers are a record of the magma around them.
Illustration — a drawing of the kind of crystal studied, not a specific specimen.
The growth zones
- Core. The core grew first, in the magma where the crystal began.
- Middle zone. Later layers wrap the core as the crystal keeps growing.
- Rim. The rim grew last. Here it is richer in magnesium than the core.
Which clue suggests this crystal met a different magma?
- A sharp change in composition near the rim — Yes. A rim richer in magnesium than the core is called reverse zoning. It suggests the crystal met hotter, more magnesium-rich magma. At Mayon, the shortest mixing times all come from reversely zoned crystals.
- The crystal’s long, blocky shape — Shape helps identify the mineral and how it grew, but on its own it does not show that the surrounding magma changed. Look at how the layers differ.
- Its colours in this picture — The colours here are an illustration choice. In the electron images scientists use, brightness tracks composition — it is the pattern of change that carries the clue.
The boundary as a clock
Atoms slowly spread across a sharp boundary. Blur it to see how the edge of a zone softens over time. Not calibrated to real time.
Back to the erupted rock
This crystal reached the surface inside lava. Zoom out to see it among the others. A crystal cluster, or glomerocryst. Mayon’s lavas hold three kinds, formed in different parts of the system.
What the crystal told you
- Crystals grow in layers that record the magma around them.
- A magnesium-rich rim is a clue that the crystal met different magma.
- The blur across a boundary is a clock: at Mayon, days to decades between mixing and eruption.
- These crystals came from lavas erupted between 1928 and 2009 — a record of the past, not a reading of today.
Inspect the growth zones
Reveal each zone, from core to rim.
How do we know? Growth zones
What was observed. Electron images of Mayon crystals show zones — layers that differ in composition from core to rim.
What researchers infer. Each layer grew in contact with melt, so changes between layers record changes in the magma around the crystal.
What the scene illustrates. The crystal here is a drawing of the kind of orthopyroxene the study measured, not a picture of one specific crystal.
What remains uncertain. A zone shows that conditions changed, not always which change caused it.
Sources.
Find the clue
Choose the clue that supports magma mixing.
How do we know? A clue to mixing
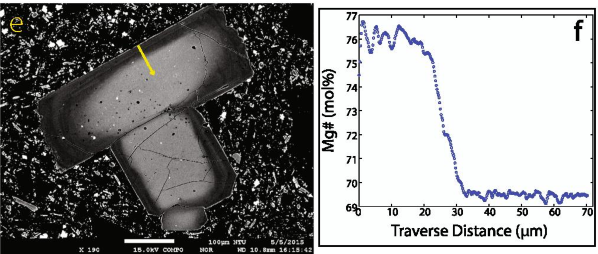
What was observed. Some orthopyroxene crystals have rims richer in magnesium than their cores — called reverse zoning. The published image shows one such crystal and a measured traverse across its edge.
What researchers infer. Reverse zoning suggests the crystal met hotter, more magnesium-rich magma — evidence of magma mixing.
What the scene illustrates. The drawing exaggerates the contrast so the zones are easy to see.
What remains uncertain. Other processes can also change a crystal’s composition, which is why many crystals are measured.
Sources.
- Ruth & Costa (2021), A petrological and conceptual model of Mayon volcano (Philippines) as an example of an open-vent volcano. Bulletin of Volcanology 83:62 · CC BY 4.0 — Fig. 7e–f; Fig. 14 caption
Read the clock
Blur the boundary with the slider.
How do we know? A clock inside the crystal
What was observed. Across the boundary between zones, composition changes gradually rather than abruptly.
What researchers infer. Atoms slowly spread across the boundary, so its width records how long passed between mixing and eruption. For more than 200 Mayon crystals, that ranged from a few days to about 65 years — mostly less than the roughly ten-year gap between eruptions.
What the scene illustrates. The slider blurs a drawn boundary to show the idea. It is not calibrated to real time.
What remains uncertain. The calculated times depend strongly on temperature; an uncertainty of about ±30 °C dominates the error.
Sources.
- Ruth & Costa (2021), A petrological and conceptual model of Mayon volcano (Philippines) as an example of an open-vent volcano. Bulletin of Volcanology 83:62 · CC BY 4.0 — Abstract; Fig. 14 caption
Back to the erupted rock
Zoom out to the lava.
How do we know? Back in the rock
What was observed. The crystals were collected from lava that erupted and cooled. The lavas also hold three kinds of crystal clusters, called glomerocrysts.
What researchers infer. The authors link the cluster types to different parts of the plumbing system, so one lava can carry crystals from several storage regions.
What the scene illustrates. The thin-section view is a drawing of a crystal-rich lava, not a photograph of a particular sample.
What remains uncertain. Which exact path any one crystal took before eruption cannot be traced.
Sources.
What the crystal told you
Sources
The full registry, including what each source does and does not support, is in the source registry and the methods note.